VistSOS
Google Summer of Code 2016 Project.
![]()
Time Series Visualization Made Easy
The goal of VistSOS is to offer an easy and flexible way of defining time series visualizations and aggregation statistics on sensor observations managed by istSOS. To accomplish this objective we took advantage of two key approaches: the Web Components specification and a declarative approach of defining charts.
For the developer interested in mantaining or improving VistSOS the implementation of the aforementioned strategy will signify an easy design to explore, understand and extend. For the end user, the definition of new charts conected to istSOS will represent an easy task.
Potential Users
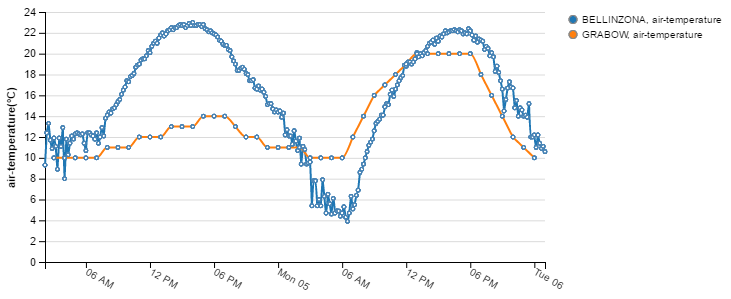
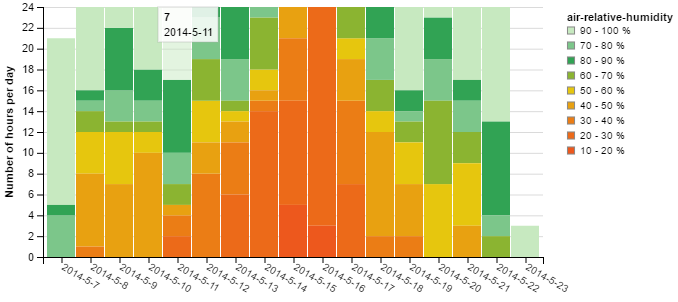
Users interested in the visualization of time series will take advantage of VistSOS. Visualizing sensor observations with one or two variables or creating histograms with different aggregation functions can open a new perspective to detect patterns and make meaningful comparisons.
Capabilities
- Line/multi-line, multi-variable, overview-detail and histogram charts.
- Easy configuration using parameters and the custom HTML element
<istsos-chart> - Use of the Web Component specification to minimize the impact in the user website.
Commits, repository, weekly reports and wiki
- To access the code repository visit VistSOS repository.
- To check the commits made until now please visit VistSOS commits.
- To read the weekly reports that summarize the development and research activities carried out during the Summer of Code 2016 please visit VistSOS weekly reports
- To read the VistSOS documentation please visit VistSOS wiki.
Thinks to Improve
Of course there is room for improvement. Please take a look at the VistSOS backlock to see the list of features to be implemented.
GSoC 2016 Proposal and Mentors
The origin of this project was a proposal submitted for the GSoC 2016 to istSOS. To read the proposal visit VistSOS proposal
Mentors:
- Massimiliano Cannata
- Milan Antonovic